INSIGHT
The Q1 FY20 Business Confidence and Performance Index (BCPI) Report
BCPI Methodology
- Over 150 Chief Executive Officers and Chief Financial Officers responded to our quarterly BCPI survey, which was run in early April, 2019
- Respondents are asked to indicate the following:
- Their outlook on current and future (3 months from today) macroeconomic conditions
- Business performance on 5 parameters (sales, confirmed new orders, net profit, net hiring, and capacity utilisation) in the most recent quarter, and one quarter ahead on an ‘Up’, ‘Down’ and ‘Same’ scale
- Whether or not they have made/will make new capital expenditures in a specific quarter
- Spending on the ‘soft things’: advertising and marketing; team/morale building exercises (offsites, company parties, etc); and aggregate travel expenditure
- The ‘headline’ (overall) BCPI is a weighted average of current conditions (40%) and expected future conditions (60%). In turn, each of these is a composite of:
- Macroeconomic conditions (25%)
- Business performance (60%) on the 5 parameters noted above
- New investments (15%)
- Index values can ranges between 0 and 100:
- Values above 50 indicate a net positive outlook on a particular parameter (more respondents say ‘Up’ than ‘Down’)
- Readings below 50 suggest a net-negative view (more say ‘Down’ than ‘Up’)
- Hypothetically, a value of 100 would suggest that every respondent has a positive outlook, while a value of 0 would indicate the opposite
BCPI Q1 FY20: Headline Results
The Q1 FY20 BCPI: Gently recovering…
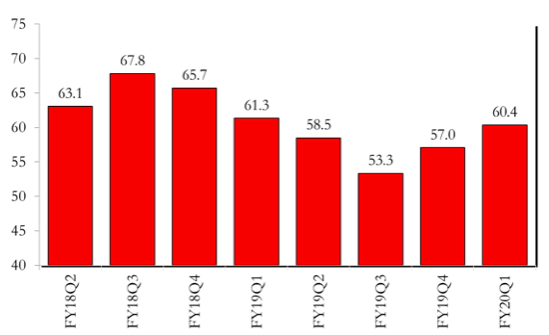
After bottoming out in October, IMA’s BCPI index has rebounded, climbing to 60.4 in Q1, FY20 – solidly above the cross-over point that signals net optimism/expansion. Core business performance, though appears to be flagging.
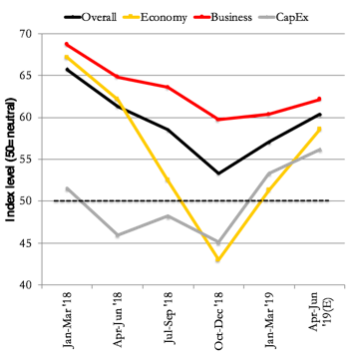
…led by an all-round lift in expectations |
|
|
|
 |
A widening Industry-Services gap (1/2) |
|
|
|
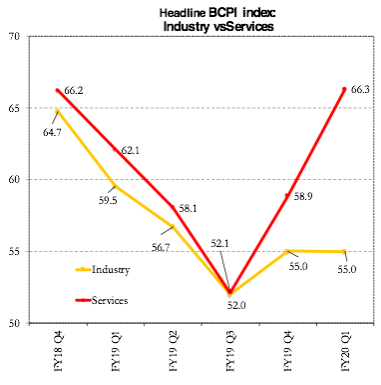 |
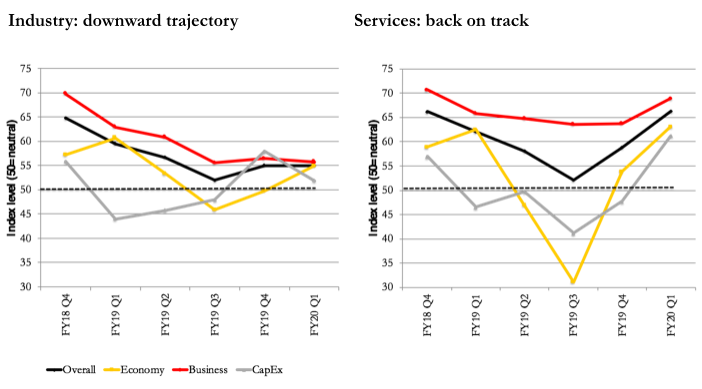
A widening Industry-Services gap (2/2) |
|
 |
|
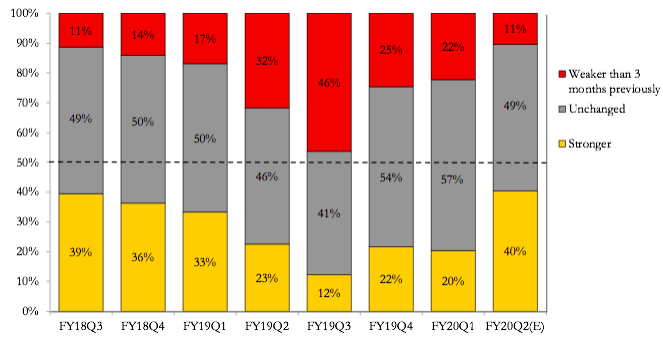
The Macro Outlook: Normalising |
|
 |
|
|
Just 20% of respondents believe that macro conditions have improved in the last 3 months – and slightly more think they have worsened – but twice as many expect things to improve by July, and few (11%) expect further deterioration. These levels – 40% ‘up’, 50% ‘unchanged’ – are broadly in line with the longer-term averages. |
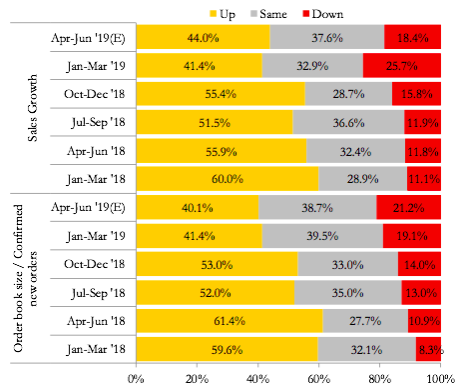
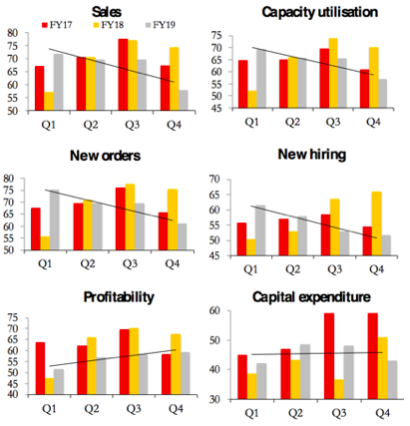
Sales and New Orders: Holding up |
|
|
|
 |
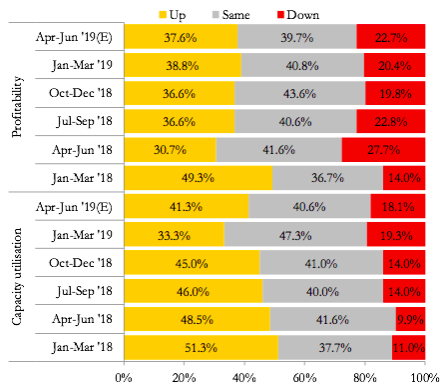
Profitability, Capacity Utilisation: Steady |
|
|
 |
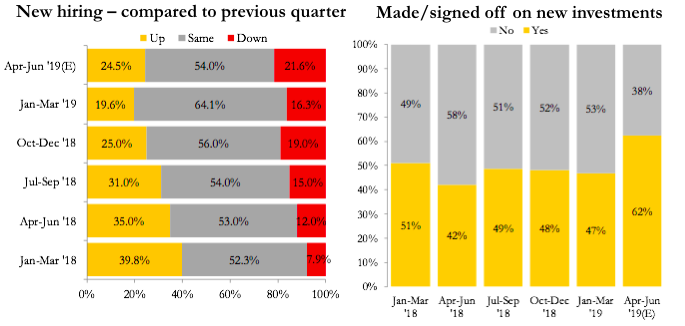
New Hiring: weak, CapEx: slow turn up |
|
 |
|
|
|
Business Parameters: YoY comparisons |
|
|
|
 |
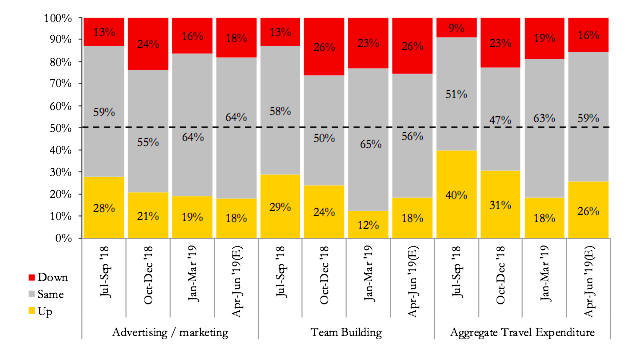
‘Soft spending’: Weakening |
|
 |
|
|
Broadly in line with recent trends, spending on advertising and marketing, and on team/morale-building is edging downwards. Travel expenditure is expected to see a mild increase over April-June, but remains constrained. |
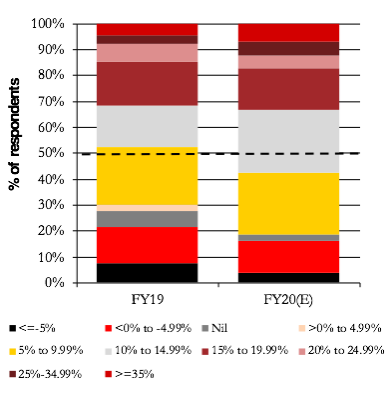
Full-year revenue growth: Strengthening |
|
|
|
 |
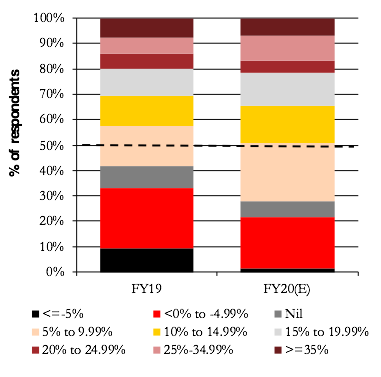
Net Profit growth: On the rise |
|
|
|
 |
 Schneider Electric is a widely-diversified business that, over the last decade, has grown strongly through multiple acquisitions, both global and domestic. Sugata Sircar, its CFO and Country Finance Partner, changed the structure of the Finance organisation to enable true business partnership, with Finance team members identifying the drivers...
 CM Gaonkar, CFO of D-Link India, talks about his journey (so far)
THINK TANK
 In conversation with Sanjay Mehta, Senior Advisor, KPMG
 In conversation with Hariharan Madhavan, Group CFO, CK Birla Group, and Sameer Zutshi, CFO Hewlett Packard India
 In conversation with Ramesh Venkat, Founder and Managing Partner, Fairwinds Asset Managers
 In conversation with Anish Shah - Group President (Strategy) – Mahindra Group